05. Rise 🌊
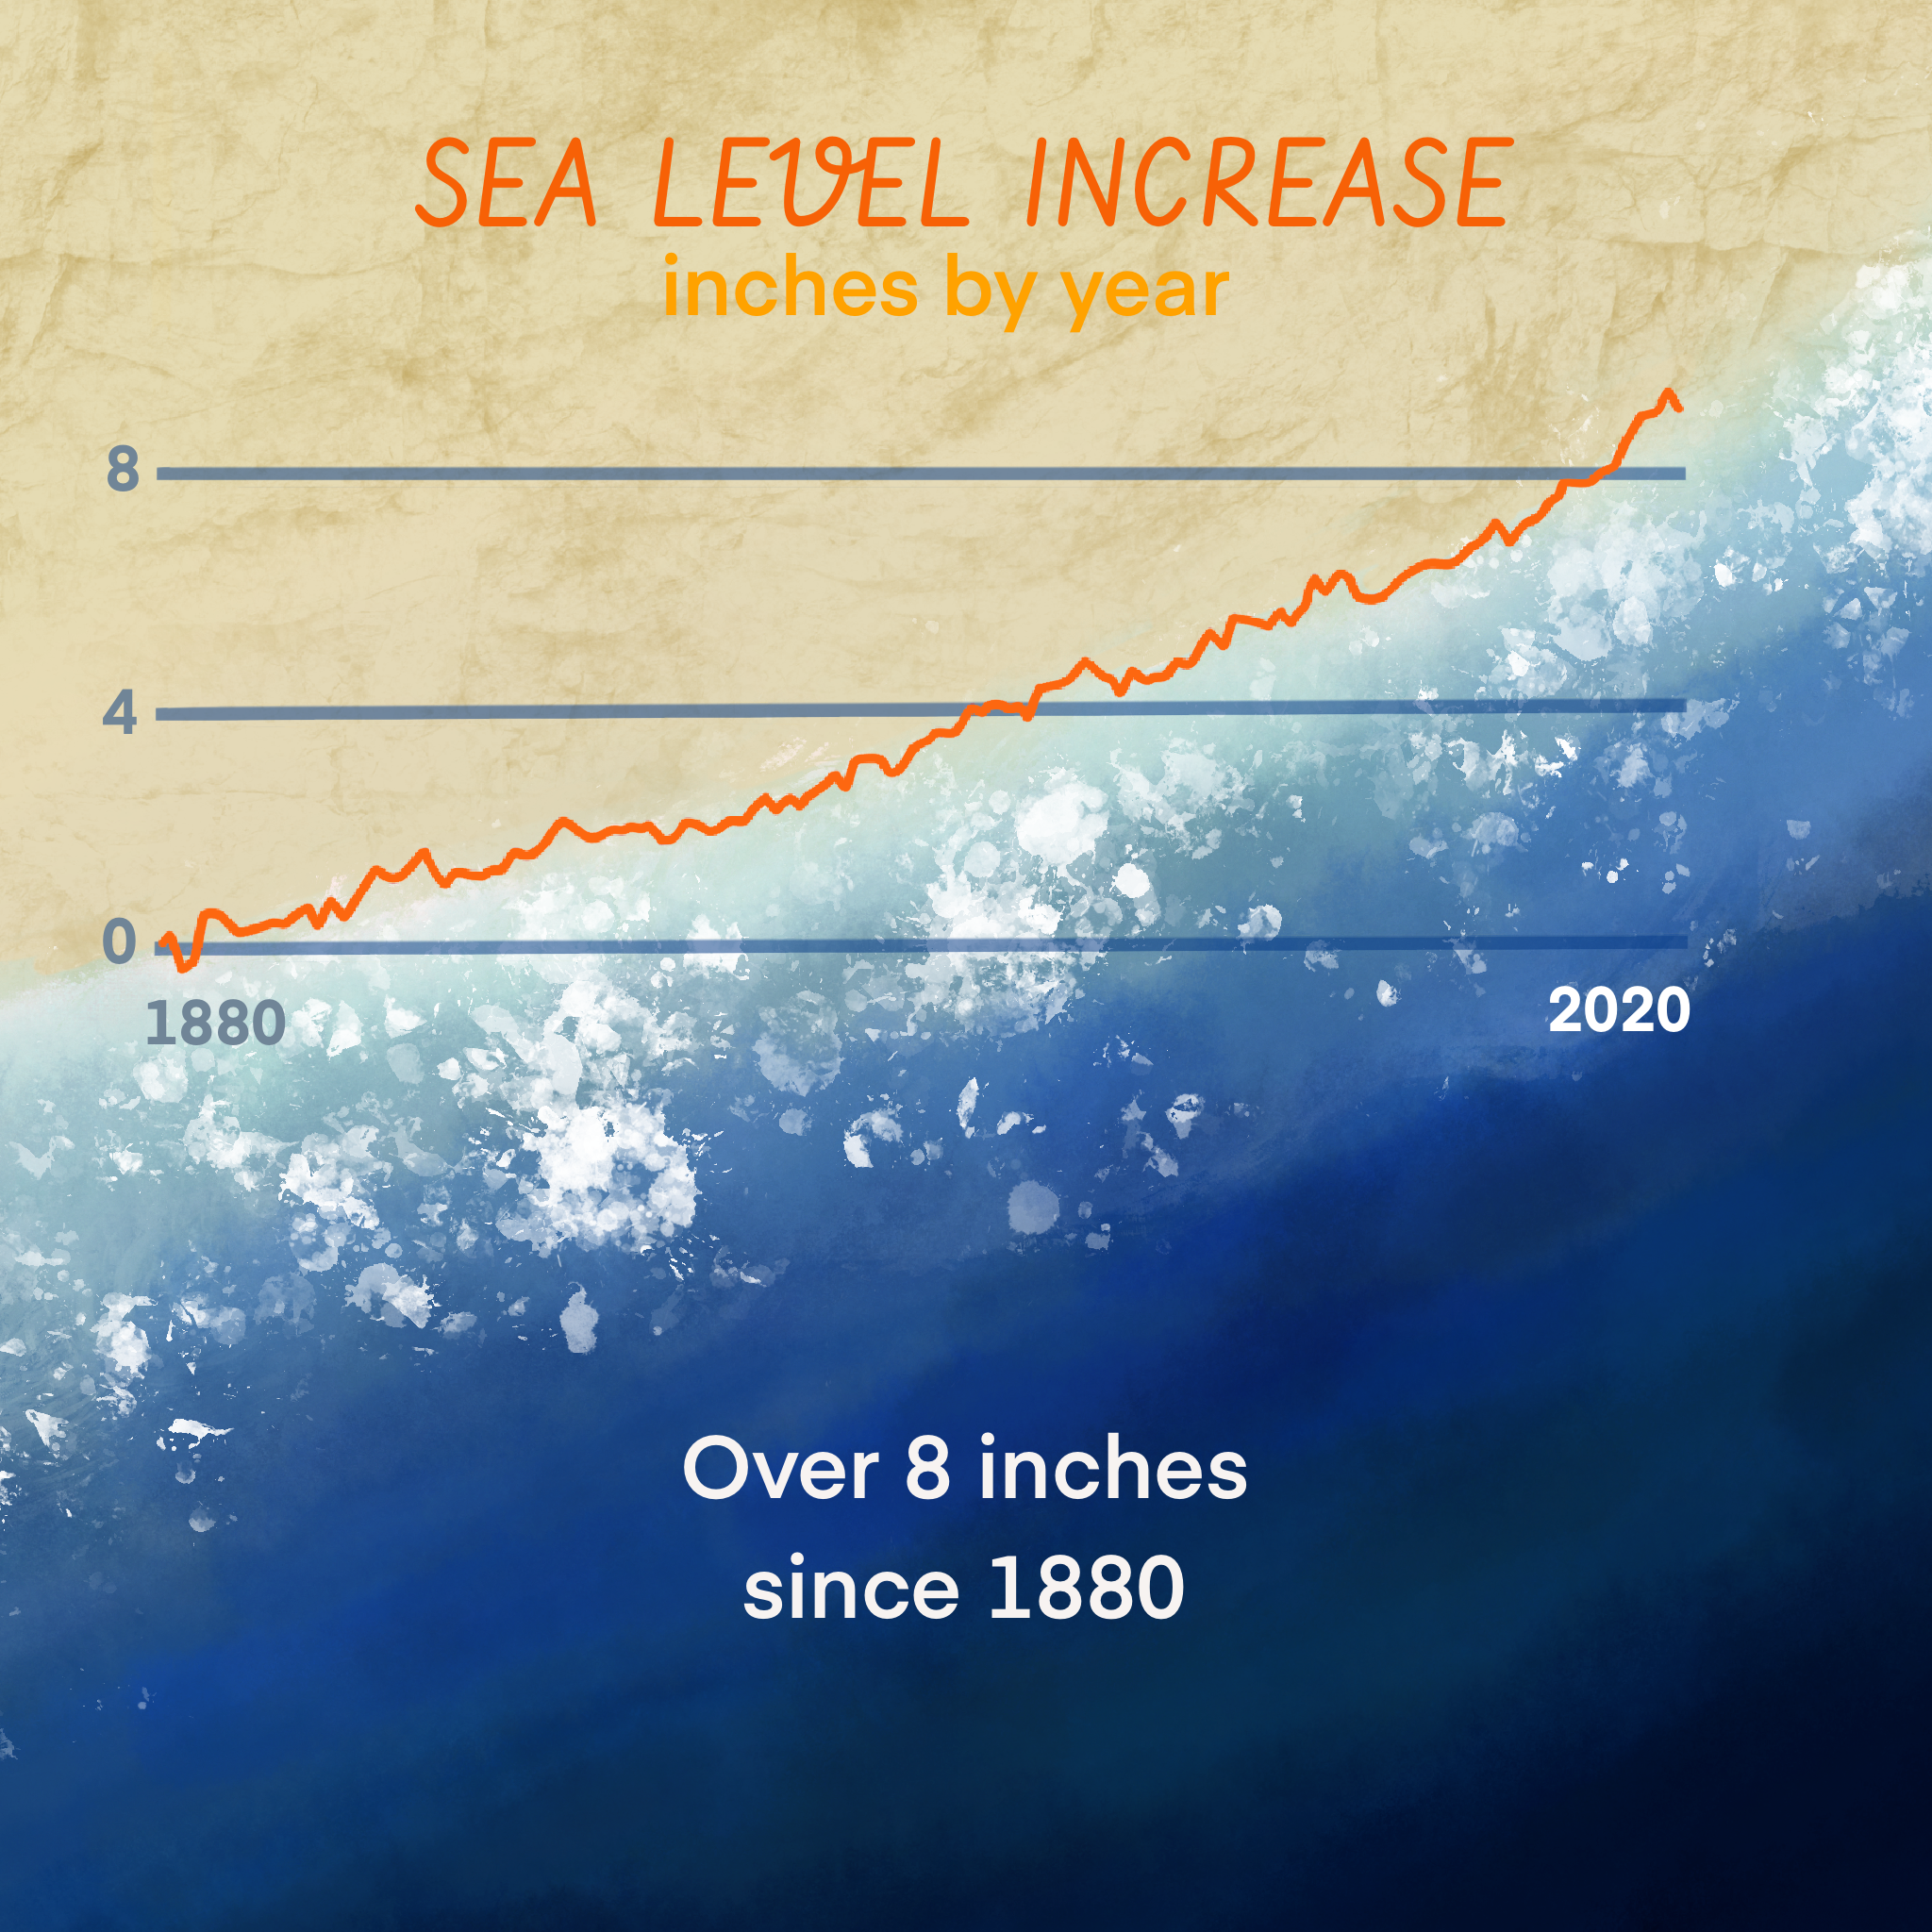
This graph came from GlobalChange.gov depicting scientific tide gauge data, collected since 1880. Their graph includes a confidence interval too.
This might seem pretty small, but 40 years is an extremely short amount of time relative to Earth’s existence, so it’s troubling to see such a noticeable increase that is execrating in recent years.
Originally, I thought I’d make this graph into a wave, but when I got to drawing it just wasn’t jiving. Then it dawned on me an aerial view could work!


